set xdata time
set timefmt "%s"
set format x "%Y-%m-%d"
#select font from results of `fc-list -v | grep -e 'family:' -e 'file:' -e '[^a-z]lang:.*zh-cn' | grep -B3 zh-cn | grep family: | sort | uniq`
set terminal png font "WenQuanYi Micro Hei,12"
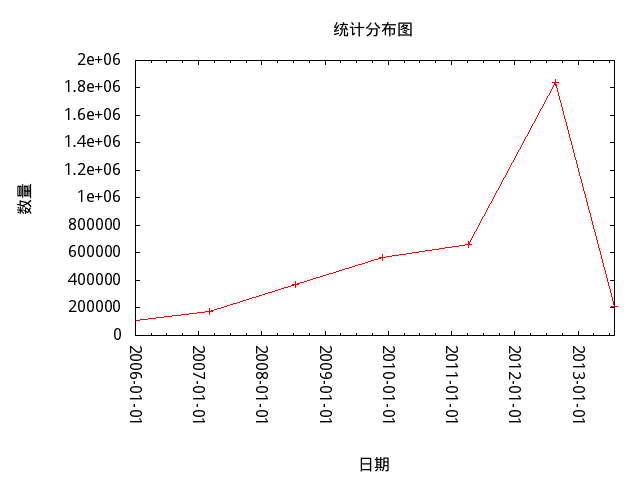
set output "test.png"
set title "統計分布圖"
set xlabel "日期"
set ylabel "數量"
set xrange ["1136044800":"1375113600"]
set xtics rotate by 270
unset key
plot "test.dat" using 1:2 with linespoints
#pause -1
$ cat test.dat
1374163200 2122926
1374249600 1200677
1374336000 1321779
1374422400 1773135
1374508800 1610589
1374595200 1454929
1374681600 1167954
1374768000 825804
1374854400 369708
1374940800 208934
$ eog test.png
$ cat t3.plt
#set terminal png
#set output "t3.png"
set title "the mget performance of redis vs cyclone"
set auto x
set xlabel "keys count"
set ylabel "latency (ms)"
set yrange [0:110]
set style data histogram
set style histogram cluster gap 1
set style fill solid border -1
set boxwidth 1
set xtic rotate by -45 scale 0
set bmargin 10
plot "redis_vs_cyclone.dat" using 2:xtic(1) title "Redis" linecolor rgb "#DAE8FC", \
"redis_vs_cyclone.dat" using 3:xtic(1) title "Cyclone" linecolor rgb "#FFCC99", \
"redis_vs_cyclone.dat" using 0:2:2 title "" with labels offset -2.0,0.7, \
"redis_vs_cyclone.dat" using 0:3:3 title "" with labels offset 2.0,0.7
pause -1
$ cat redis_vs_cyclone.dat
Service Redis Cyclone
100 0.2 1.3
500 0.6 1.7
1000 1.2 1.9
5000 6.1 3.9
10000 13.3 5.4
20000 25.4 7.6
50000
73.7
16.4
$ gnuplot t3.plt

$ cat t4.plt
set xlabel "月份"
set ylabel "降水量(毫米)"
set title "各城市月平均降水量"
set xrange [0.5:12.5]
set xtics 1,1,12
plot "jiangshui.dat" u 1:2 with linespoints pointtype 5 linecolor 'red' title "重慶", \
"jiangshui.dat" u 1:3 with linespoints pointtype 7 linecolor 'blue' title "成都", \
"jiangshui.dat" u 0:2:2 with labels offset 0.0,1.0 title "", \
"jiangshui.dat" u 0:3:3 with labels offset 0.0,1.0 title ""
pause -1
$ cat jiangshui.dat
月份 重慶 成都
1 2.5 38.1
2 5.1 58.4
3 10.2 81.3
4 25.4 101.6
5 27.9 114.3
6 71.1 152.4
7 175.3 129.5
8 182.9 132.1
9 48.3 154.9
10 17.8 61.0
11 5.1 50.8
12 2.5 35.6
$ gnuplot t4.plt

一套更易用的數據收集以及畫圖解決方案:Grafana + influxdb