Recently, our performance testing result is being very strange: suddenly much slower or much faster than the previous testing. This situation lasts for a pretty long time. And the unstable testing result makes us very confusing and doesn't believe anything and caused lots of back and forward work (such as testing scripting changes).
However, it is normal cases of performance testing. We have to face it. This article is trying to explain why the performance testing result is always changing and how can we avoid it.
NOTE: this article just introduced some basic ideas, i hope more discussion on this topic and finally we are not confusing any more.
The Performance of Java Application is Not Stable Inherently?
Measuring the performance and understanding the behaviour of Java programs is challenging. Many factors, from program characteristics, VM techniques and implementations, and OS strategies, DB Optimization to hardware platform performance, can affect the final measured performance.
1. What's the status of hardware?
As we all know, hardware is the basic of performance. However, we don't know what's the exact performance benchmark of our hardware? Most of people may notice one fact: two computers may perform very differently even they have the exact same hardware. So, we need some tool to compare them.
Even for the same machine, we are always noticing that server's status varies vastly at different times. We cannot assume the server is always perform at the same level. Disk maybe become slower and slower. A virus maybe absorbed CPU time crazily. Another process maybe occupied huge memory.
2. JVM Optimization
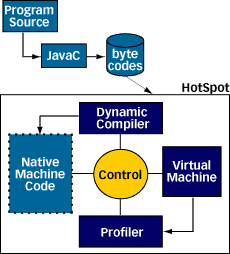
As we know, Sun HotSpot JVM actually includes both a dynamic compiler and a virtual machine to interpret bytecodes, as shown in the following figure.

When bytecodes are first loaded, they are run through the
interpreter. The profiler keeps a record of runtimes for each method.
When a method is found to be taking a lot of time, HotSpot compiles and
optimizes it. Every future call to that method uses the native machine
instructions produced by the compiler.
As with a JIT, the
results of the compilation are not kept between runs. Because the
bytecodes are more compact, this saves loading time as well as storage
space. It also retains portability, and allows the optimization to
reflect the way the program is currently being used. Currently, no
attempt is made to save information that might help future runs become
efficient more quickly.
In other words, HotSpot JVM will optimize some critical methods during runtime. So, the execution time of each method will change during the execution time.
3. SQL Server Optimization
MS SQL Server is a very powerful database. It will do lots of optimization to improve query performance at runtime. SQL Server Performance Optimization is a very complicated topic, here we just try to emphasize some points -
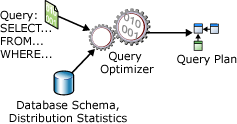
(1)As you see from the following diagram, any single statement will optimized into Query Plan by Query Optimizer based on query statements, database schema and statistics. SQL Server 2005 has a pool of memory that is used to store both
execution plans and data buffers. The percentage of the pool allocated
to either execution plans or data buffers fluctuates dynamically,
depending on the state of the system. SQL Server 2005 has an efficient algorithm to find any existing
execution plans for any specific SQL statement. In most systems, the
minimal resources that are used by this scan are less than the
resources that are saved by being able to reuse existing plans instead
of compiling every SQL statement.

(2) Disk I/O is a core characteristic of the Database. SQL Server has one component named Buffer management will try to mange the reading and writing database pages and cache database pages to reduce file I/O. It is also a dynamic process.
4. Application Errors
Another very importance factor impacting application performance result is application runtime errors. As most of us noticed again and again, the application error will greatly impact the stability of the server and make the server very unstable.
The recent example is, SM performance testing finds that the latest performance testing is much slower that the pervious testing and the thoughout is very unstable during the testing. However, if one of the report testing is removed from testing scripts, the performance testing is much slower and the result is much reasonable. As we all know, the report component is one of the root cause of server crash and out-of-memory issues. So, if we try to test the performance with report module, the result doesn't make much sence.
How can we get trusted result?
1. Fix Errors Before Testing
First of all, please fix the errors. There are several errors we must notice:
(1) Lots of Exceptions on log file
(2) Server crash issue and out-of-memory issue
No serious error is the precondition of the stable performance testing result.
2. Run benchmark tool before running application
There are lots of good PC performance benchmark tool, i selected
PassMark Performance Testing
(http://www.passmark.com/download/pt_download.htm) which is very easy
to use, understand and compare.
I did a quick testing on my laptop and one of the high-performance server. The result shows huge differences -
|
|
Overall
|
CPU
|
Memory
|
Disk
|
|
My Laptop
|
388.9
|
943.5
|
441.3
|
155.4
|
|
High-Performance Server
|
1627.4
|
3155.9
|
835.7
|
1541.2
|
|
Comparison Result
|
around 4.2 times
|
around 3.5 times
|
around 2 times
|
aournd 9.9 tiems
|
The results displays the Disk is the biggest difference among
these two servers. So, the disk-sensitive operations may impact the
overall performance if the testing is running at my laptop.
Another very interesting benchmark is JVM benchmark tool (SPECjvm2008, http://www.spec.org/jvm2008/docs/UserGuide.html), which is designed to measure the
performance of a JRE (a JVM and associated libraries). It also
measures the performance of the operating system and hardware in the
context of executing the JRE. It has a complicated evaluation process, and we may only need see the final result. The following is an example -
the score pf My Laptop is 35.6 ops/m, while the score of high-performance server is 51.8 ops/m.
3. A Little Bit Long Time Running
As we saw in the previous section, modern software applied so many optimization techniques during runtime, so the response time is changing during the testing. Giving a little bit more time as the warm-up time is reasonable. However, how-long it need need trade-off and the support of experiences.
4. Dig into Enough Detail (even single line of code if need)
Last but actually most important, not be fooled by a overall result.
Because performance testing and tuning is very time-consuming activity
and need a lot of patience, we always try to get evidence or clues from
a big picture. However, a big picture or overall result is always in
changing, it cannot tell you much on the real performance from testing
and tuning perspective. Generally, the product-wide multiple
functionality testing can be used as an overall summary of product
performance, but it is not beneficial on bottleneck trouble shooting.
The
only way to find the real performance issue is trying to dig into
detailed module/function/even single line of code or query. Only based
on these detailed, you have the confidence to say the tuning works or
not.
In summary, we always met the performance result stability issue during performance testing. This article tries to explain why an java application will perform differently at different time, there are too many factors impacting this, and how can we get a more trustable results. This article is a first try to explain this topic, i hope more and more discussion will make us clearer.
posted on 2009-03-09 23:25
Justin Chen 閱讀(1542)
評論(1) 編輯 收藏 所屬分類:
Performance