JStockChart -- Getting Started(Timeseries)
本文以一個示例介紹了如何利用JStockChart生成金融時序圖。(2009.11.23最后更新)
1. 環境要求
需要JDK 1.5或更高版本。
2. 下載與安裝
從JStockChart的站點中下載它的最新版本,當前版本是0.4.2。
解壓JStockChart的zip文件(jstockchart-0.4.2.zip)后,將jstockchart目錄中的jstockchart-0.4.2.jar和jstockchart/lib目錄中的jcommon-1.0.16.jar和jfreechart-1.0.13.jar加到classpath中。
3. 示例
在JStockChart的發行包中,有一個demo目錄。該目錄包含了一個簡單的例子,展示了如何利用JStockChart去生成時序圖。demo目錄中有一個Ant腳本build.xml,在該目錄下執行命令ant即可運行該示例程序。下面是該示例的關鍵代碼及其說明。
public class TimeseriesChartDemo {
public static void main(String[] args) throws IOException {
// 
// 創建一個包含TimeseriesItem的List實例。
// 在此處,通過查詢db4o的數據庫文件,直接獲得該List.
// 注意:所有的數據,都必須在"同一天"內。
List data = ;
// 創建SegmentedTimeline實例,表示時間區間"00:00-11:30,13:00-24:00"(即24小時中空缺了"11:31-12:59"這段時間)。
SegmentedTimeline timeline = new SegmentedTimeline(
SegmentedTimeline.MINUTE_SEGMENT_SIZE, 1351, 89);
timeline.setStartTime(SegmentedTimeline.firstMondayAfter1900()
+ 780 * SegmentedTimeline.MINUTE_SEGMENT_SIZE);
// 創建TimeseriesDataset實例,時間間隔為1分鐘。
TimeseriesDataset dataset = new TimeseriesDataset(Minute.class, 1, timeline, true);
// 向dataset中加入TimeseriesItem的List。
dataset.addDataItems(data);
// 創建邏輯價格坐標軸。指定中間價為21,顯示9個坐標值,坐標值的格式為".00"。
CentralValueAxis fixedPriceAxis = new CentralValueAxis(new Double("21"), new Range(
dataset.getMinPrice().doubleValue(), dataset.getMaxPrice().doubleValue()),
9, new DecimalFormat(".00"));
// 創建價格區域
PriceArea priceArea = new PriceArea(fixedPriceAxis);
// 創建邏輯量坐標軸。顯示5個坐標值,坐標值的格式為"0"。
FixedNumberAxis fixedVolumeAxis = new FixedNumberAxis(new Range(dataset
.getMinVolume().doubleValue(), dataset.getMaxVolume()
.doubleValue()), 5, new DecimalFormat("0"));
// 創建量區域
VolumeArea volumeArea = new VolumeArea(fixedVolumeAxis);
// 創建時序圖區域
TimeseriesArea timeseriesArea = new TimeseriesArea(priceArea,
volumeArea, createFixedDateAxis(DateUtils.createDate(2008, 1, 1)));
// 通過JStockChartFactory的工廠方法生成JFreeChart實例。
// 指定了該圖的標題為"Timeseries Chart Demo",并且不生成圖例(legend)。
JFreeChart jfreechart = JStockChartFactory.createTimeseriesChart(
"Timeseries Chart Demo", dataset, timeline, timeseriesArea, false);
// 創建圖像文件。圖像格式為PNG,長為545,寬為300。
ChartUtilities.saveChartAsPNG(new File(imageFile), jfreechart, 545, 300);
}
// 指定時期坐標軸中的邏輯坐標。
private static FixedDateAxis createFixedDateAxis(Date baseDate) {
FixedDateAxis fixedDateAxis = new FixedDateAxis(baseDate,
new SimpleDateFormat("HH:mm"));
fixedDateAxis.addDateTick("09:30", TickAlignment.START);
fixedDateAxis.addDateTick("10:00");
fixedDateAxis.addDateTick("10:30");
fixedDateAxis.addDateTick("11:00");
fixedDateAxis.addDateTick("11:30", TickAlignment.END);
fixedDateAxis.addDateTick("13:00", TickAlignment.START);
fixedDateAxis.addDateTick("13:30");
fixedDateAxis.addDateTick("14:00");
fixedDateAxis.addDateTick("14:30");
fixedDateAxis.addDateTick("15:00", TickAlignment.END);
return fixedDateAxis;
}
}
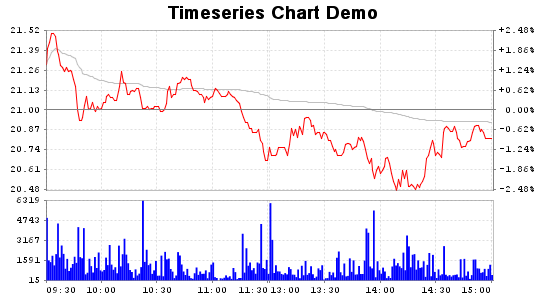
運行該示例程序后,可以生成如下圖片:
4. 定制圖表
由于JFreeChart具有高度的可定制性,所以當生成了JFreeChart實例后,你可以從中獲取圖表中的各個元素,如Plot,然后再定制它們的屬性。詳細信息請參見JFreeChart的站點和論壇。
另外,在創建JStockChart的XXXArea對象時,也可以直接定制若干屬性。如,通過PriceArea類,可以設置價格線的顏色(PriceArea.setPriceColor),均線的顏色(PriceArea.setAverageColor);是否顯示均線(PriceArea.setAverageVisible);是否顯示漲跌幅(PriceArea.setRateVisible);...。詳細信息請參見JStockChart的API文檔。