未經(jīng)許可的轉(zhuǎn)載,本人保留一切法律權(quán)益。
一直以來(lái),發(fā)現(xiàn)有某些人完全不尊重我的勞動(dòng)成果,隨意轉(zhuǎn)載,提醒一下那些人小心哪天惹上官司。
IBM Pattern Modeling and Analysis Tool for Java Garbage Collector(簡(jiǎn)稱GA),大名鼎鼎的IBM用來(lái)分析JDK GC日志的工具,2008年8月23日,更新至2.6版,增加了對(duì)Java 6 GC日志的分析。
我想這也是為了配合Websphere Application Server 7.0的測(cè)試版發(fā)布,在我之前的一篇文章《WebSphere Application Server 7.0 初體驗(yàn)》中曾經(jīng)提到,GCViewer這個(gè)工具目前還無(wú)法查看其GC的日志,現(xiàn)在不用擔(dān)心這個(gè)問(wèn)題了,用GA2.6來(lái)看吧。
來(lái)看看官方的簡(jiǎn)介:
 What?is?Pattern?Modeling?and?Analysis?Tool?for?IBM?Java?Garbage?Collector?
 Pattern?Modeling?and?Analysis?Tool?for?IBM??Java??Garbage?Collector?(PMAT)?parses?verbose?GC?trace,?analyzes?Java?heap?usage,?and?recommends?key?configurations?based?on?pattern?modeling?of?Java?heap?usage.?
 When?the?JVM?(Java?virtual?machine)?cannot?allocate?an?object?from?the?current?heap?because?of?lack?of?space,?a?memory?allocation?fault?occurs,?and?the?Garbage?Collector?is?invoked.?The?first?task?of?the?Garbage?Collector?is?to?collect?all?the?garbage?that?is?in?the?heap.?This?process?starts?when?any?thread?calls?the?Garbage?Collector?either?indirectly?as?a?result?of?allocation?failure?or?directly?by?a?specific?call?to?System.gc().?The?first?step?is?to?get?all?the?locks?needed?by?the?garbage?collection?process.?This?step?ensures?that?other?threads?are?not?suspended?while?they?are?holding?critical?locks.?All?other?threads?are?then?suspended.?Garbage?collection?can?then?begin.?It?occurs?in?three?phases:?Mark,?Sweep,?and?Compaction?(optional).?
 Verbose?GC?is?a?command-line?option?that?one?can?supply?to?the?JVM?at?start-up?time.?The?format?is:?-verbose:gc?or?-verbosegc.?This?option?switches?on?a?substantial?trace?of?every?garbage?collection?cycle.?The?format?for?the?generated?information?is?not?designed?and?therefore?varies?among?various?platforms?and?releases.?
 This?trace?should?allow?one?to?see?the?gross?heap?usage?in?every?garbage?collection?cycle.?For?example,?one?could?monitor?the?output?to?see?the?changes?in?the?free?heap?space?and?the?total?heap?space.?This?information?can?be?used?to?determine?whether?garbage?collections?are?taking?too?long?to?run;?whether?too?many?garbage?collections?are?occurring;?and?whether?the?JVM?crashed?during?garbage?collection.?
更多訊息,可以參考其官方網(wǎng)站:
http://alphaworks.ibm.com/tech/pmat
WAS的GC日志的獲得方法,可以參見(jiàn)我的另一篇文章《WebSphere Application Server 7.0 初體驗(yàn)》,當(dāng)然也可以看WAS的文檔或此軟件的文檔。
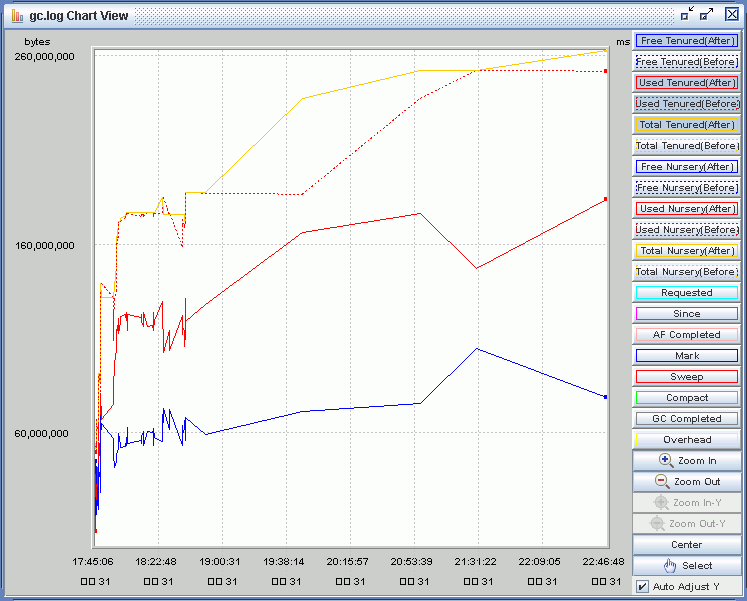
下圖是我試用WAS7.0產(chǎn)生的GC Log的Chart View:

有興趣的朋友們可以試試看。
posted on 2008-09-01 00:11 Robin's Programming World 閱讀(3255) 評(píng)論(0) 編輯 收藏 所屬分類: Java 、Webshere


